
Static Characteristics of Instruments
Select a topic heading to view its detailed content
1. Static Characteristics of Instruments
Static characteristics describe an instrument's performance under steady-state conditions, measuring accuracy, precision, sensitivity, range, linearity, hysteresis, resolution and other paremeters. These parameters indicate measurement quality and help select appropriate instruments. These characteristics determine instrument suitability for specific applications and guide calibration requirements.
2. Resolution and Sensitivity
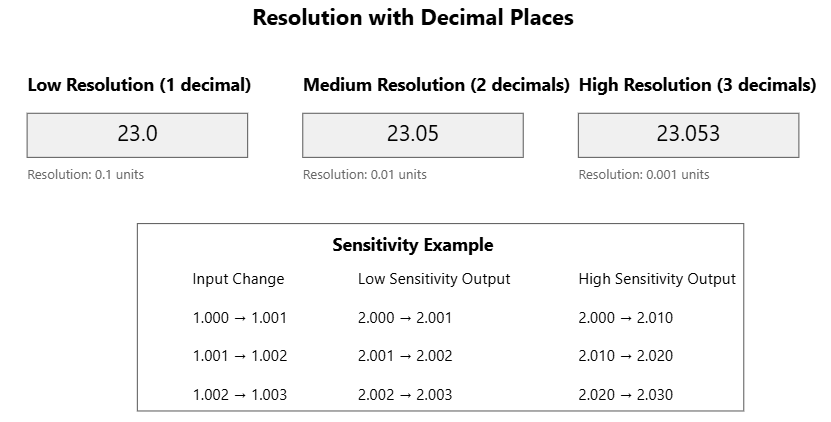
Resolution refers to the smallest change in the measured value that an instrument can detect and display reliably. It represents the finest increment that can be distinguished by the measuring device. For example, if a digital thermometer shows temperature to 0.1°C, that's its resolution - it cannot detect temperature changes smaller than 0.1°C.
Sensitivity is the ratio of change in output signal to the corresponding change in input being measured. It describes how much the output of an instrument changes when there is a change in what it's measuring. High sensitivity means that a small change in input creates a large change in output.
To illustrate the difference:
- A digital scale with a resolution of 0.1g can display weight changes in steps of 0.1g
- If this scale changes its display by 10 digits for every 1g change in weight, its sensitivity would be 10 digits/gram
These concepts are often confused but serve different purposes:
- Resolution determines the finest measurement increment possible
- Sensitivity determines how responsive the instrument is to changes in the measured variable
Both characteristics are important for choosing appropriate instruments for specific measurement needs. High resolution is crucial when you need to detect very small changes, while high sensitivity helps in measuring subtle variations accurately.
3. Threshold vs resolution
Threshold in instrumentation refers to the smallest change in input that can produce a detectable change in the output of a measuring instrument. It's essentially the minimum stimulus required to cause a measurable response.
The key differences between threshold and resolution in instrumentation:
Resolution:
- The smallest increment that can be displayed or read on the instrument
- Determined by the instrument's display or readout capability
- Is a specification of the measuring device's display
- Example: A digital multimeter showing readings to 0.01V has a resolution of 0.01V
- May be limited by the number of decimal places or display digits
- Is the finest division of the instrument's scale
Threshold:
- The smallest actual change in input that causes a detectable change in output
- Determined by the instrument's sensing capability
- Is a characteristic of the instrument's sensing mechanism
- Example: A thermocouple might need a 0.2°C change to produce a detectable signal change
- Limited by the physical and electronic properties of the sensor
- Is the minimum measurable value
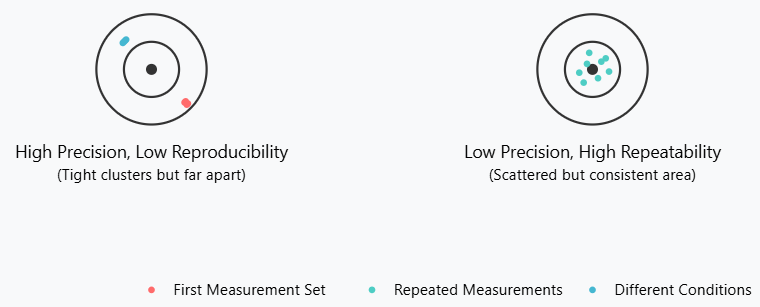
4. Precision, Repeatability and reproducibility
Precision refers to how close repeated measurements of the same quantity are to each other under the same conditions. It's about consistency in measurements, regardless of whether they're accurate or not. For example, if you measure a 100°C temperature five times and get readings of 98.1°C, 98.2°C, 98.0°C, 98.2°C, and 98.1°C, the instrument has high precision because the readings are very close to each other, even though they're not exactly at 100°C.
Repeatability is the ability of the same instrument to give identical measurements when measuring
the same quantity under the same conditions over a short period.
This includes:
- Same measurement method
- Same observer
- Same measuring instrument
- Same location
- Same conditions
- Measurements made over a short period
For example, if a technician measures a voltage repeatedly with the same voltmeter in the same environment within an hour, the degree of agreement between these measurements indicates the instrument's repeatability.
Reproducibility differs from repeatability in that it measures the agreement between results when the measurement conditions change.
These changes can include:
- Different operators
- Different measuring instruments
- Different locations
- Different times
- Different measurement methods
For instance, if two different laboratories measure the same sample using different equipment and get similar results, this demonstrates good reproducibility. It's particularly important in scientific research and quality control where results need to be verified by independent sources.
These three concepts are crucial for understanding the reliability and capability of measurement instruments. While precision focuses on measurement consistency, repeatability and reproducibility help validate the measurement process across different conditions and settings.
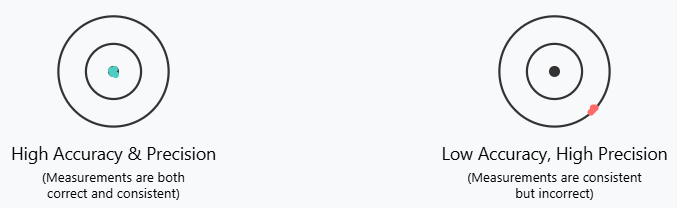
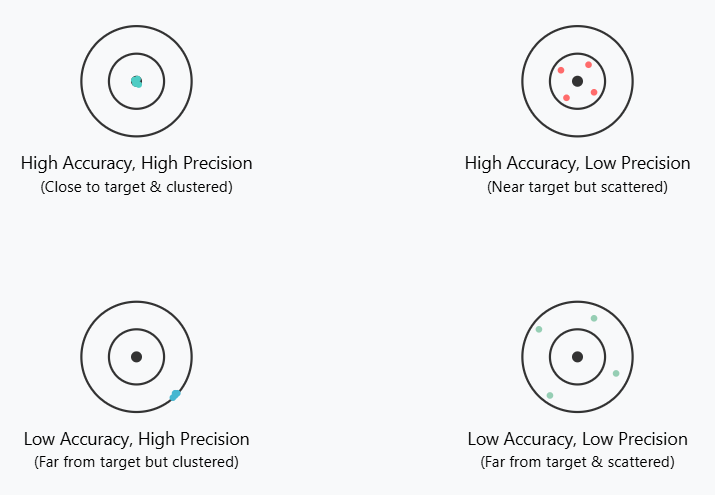
5. Accuracy Vs precision
Accuracy is about how close your measurement is to the true or correct value. For example, if a standard weight is exactly 100 grams, and your scale measures it as 99.9 grams, that's high accuracy because it's very close to the true value.
See my accuracy calculator here
Example if we have a temperature transmitter where span is 100°C. The true value is 50(°C), but the instrument measure 52°C. The deviation is 2°C at 50°C. we can use the "Absolute error of range" calculator in Tools section.
Precision is about how close repeated measurements are to each other, regardless of whether they're correct or not. For example, if you weigh the same object three times and get 95.1 grams, 95.2 grams, and 95.0 grams, that's high precision because the measurements are very close to each other (even though they might not be accurate).
In the following figures, you can see illustrations of this.
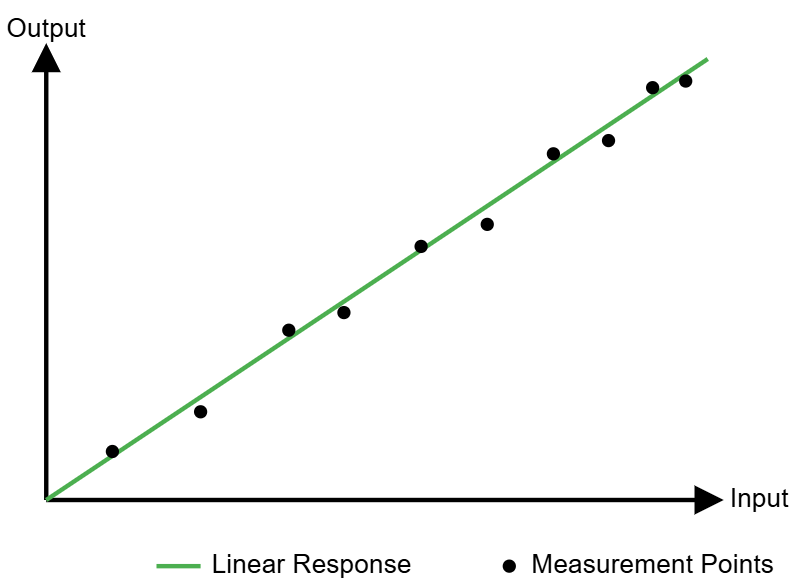
6. Linearity and non-linearity
In instrumentation, linearity refers to the relationship between the input and output of a measuring instrument. Linear systems have a direct proportional relationship - the output changes uniformly with changes in input. For example, if you double the input, the output doubles. This can be represented by a straight line on a graph.
Non-linearity occurs when this relationship isn't perfectly proportional. The output
may change disproportionately compared to input changes.
Common causes include:
- Sensor characteristics
- Material properties
- System limitations
- Environmental factors
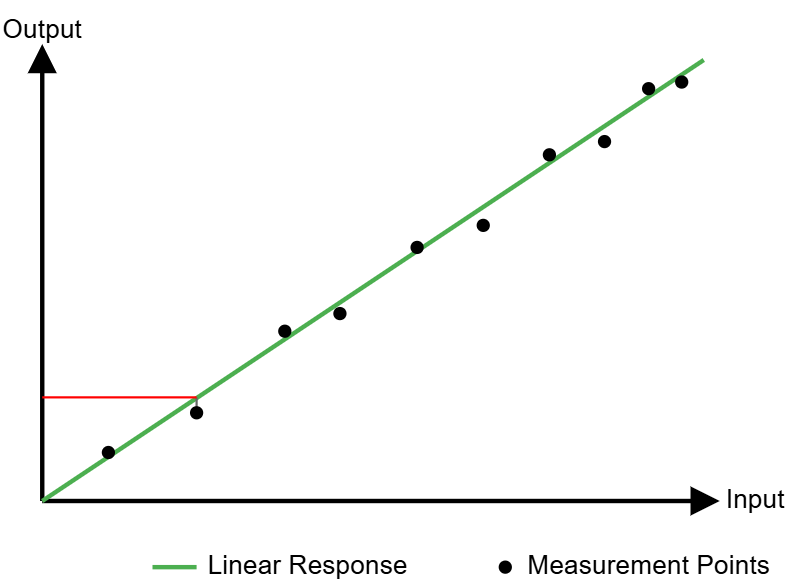
As shown in the figure, the green line represents the ideal linear response. However, when you connect the actual measured points (black dots), you can see that they deviate from the ideal line. These deviations indicate that the actual measurements are non-linear.
We can calculate the non-linearity. See graph under.
If the grey line from the black dot to the green line measures 0.5 units, and
the red line intersects the y-axis at 13 units, we can calculate the non-linearity
as a percentage of full scale.
If this measured point was the biggest deviation from the linearity line we would call this the maximum non-linearity.
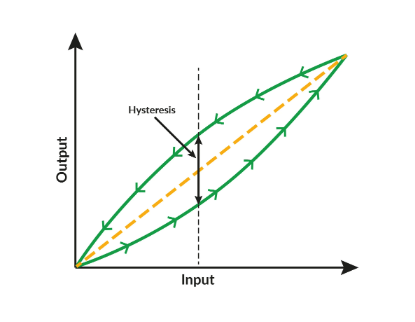
7. Hysteresis, deadband and offset
1. Hysteresis
Hysteresis in instrumentation is an important concept that describes the dependency of an instrument's output not just on its current input, but also on its previous state or history. Let me explain this in detail:
Basic Definition:
Hysteresis is the difference in an instrument's response when approaching a point from opposite directions. It represents a "lag" or "memory effect" in the system.
How it Works:
- When input increases: The system follows one path
- When input decreases: The system follows a different path
- The difference between these paths creates a loop called the hysteresis loop
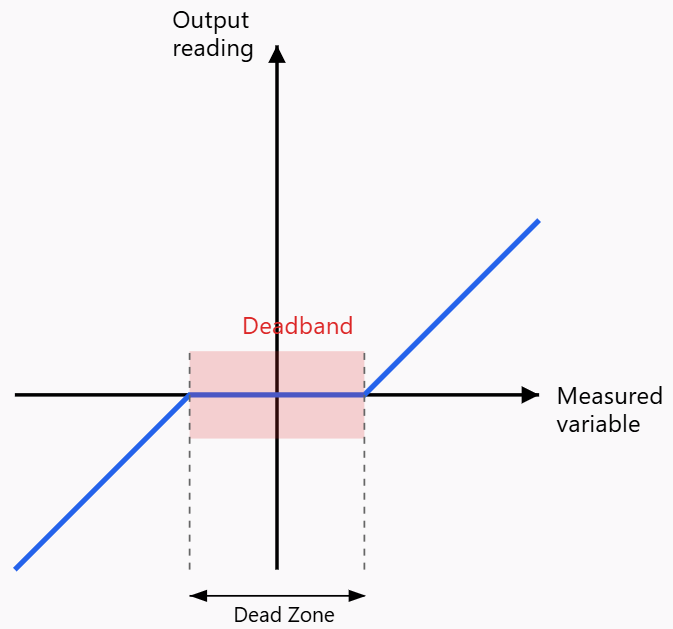
2. Deadband, Dead zone or dead space
Deadband is defined as the range of different input values over which there is no change in output value. Any instruments that exhibits hysteresis also display deadband.
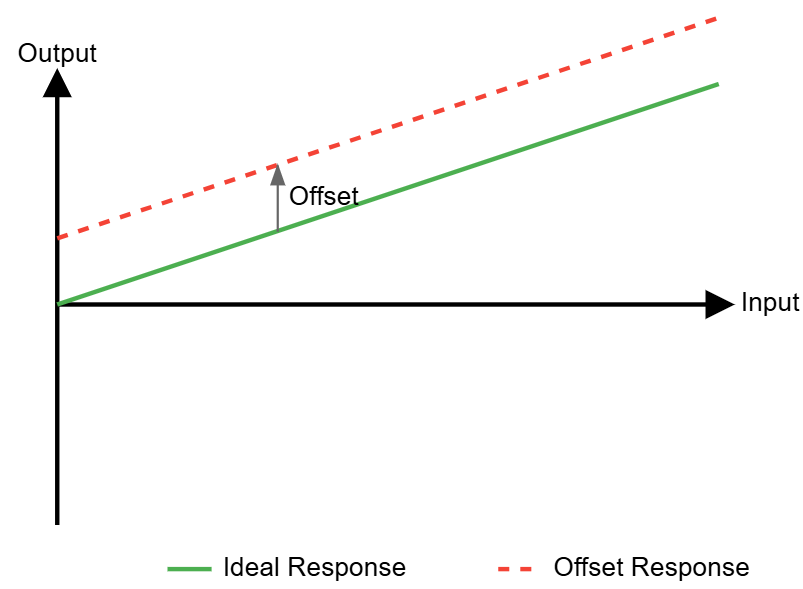
3. Offset
The offset offset in instrumentation represents the difference between the indicated value and the actual value. If a temperature sensor reads 4°C when the actual temperature is 2°C, it has an offset of +2°C.
8. Bias and Zero drift
Bias is a consistent and systematic deviation from the true value in measurements. It represents a fixed or predictable error that causes readings to be consistently higher or lower than the actual value. For example, if a temperature sensor consistently reads 2°C higher than the actual temperature, that's a bias error.
Zero drift refers to the gradual change in the output of an instrument when there should be zero input. It's a type of error where the baseline or "zero point" of the instrument shifts over time, even when measuring nothing. For instance, if a weight scale shows 0.1kg when nothing is placed on it, and later shows 0.2kg with still nothing on it, that's zero drift.
Key differences between bias and zero drift:
- Time dependency: Bias is typically constant over time, while zero drift changes gradually over time
- Predictability: Bias is usually systematic and can often be compensated for through calibration, while drift is less predictable
- Cause: Bias often results from calibration errors or design flaws, while drift commonly occurs due to environmental factors like temperature changes, component aging, or electronic noise
9. Tolerance
Tolerance in instrumentation refers to the maximum allowable error or deviation from the true value that is acceptable in measurements while still maintaining the instrument's specified performance. It represents the range within which a measurement can vary and still be considered valid or acceptable for its intended purpose.
Let me break down the key differences between tolerance and accuracy in instrumentation:
Accuracy:
- Refers to how close a measurement is to the true or actual value
- Is a measure of the degree of conformity of a measured value to the actual value
- Usually expressed as a percentage of full scale, span, or reading
- Cannot be adjusted or set by manufacturers or users
- Is an inherent quality of the instrument
Tolerance:
- Is the maximum allowable deviation from a specified value
- Represents the acceptable range within which a measurement can fall
- Is deliberately set based on application requirements
- Can be adjusted based on needs and specifications
- Is a design or engineering specification
10. Aging
Aging in instrumentation refers to the gradual changes that occur
in measuring instruments and sensors over time, affecting their accuracy, reliability,
and performance. Here are the key aspects:
Primary Effects of Aging:
- Zero drift: The baseline reading shifts from its original calibrated position
- Span drift: The relationship between input and output changes over time
- Response time degradation: The instrument becomes slower in reacting to changes
- Increased noise: More random fluctuations appear in measurements
- Physical deterioration: Components like seals, membranes, or electrical connections degrade
Major Causes:
1. Environmental factors:
- Temperature cycling
- Humidity exposure
- Vibration and mechanical stress
- Chemical exposure
- Radiation exposure
2. Usage patterns:
- Continuous operation vs intermittent use
- Operating outside specified ranges
- Mechanical wear from moving parts
- Electrical stress from power cycling
Mitigation Strategies:
- Regular calibration programs
- Preventive maintenance schedules
- Environmental controls
- Redundant systems for critical measurements
- Proper storage when not in use
11. Gain ratio
Gain ratio in instrumentation refers to the relationship between output and input
signals.
It's mathematically expressed as:
For example, if a temperature transmitter has a range from 0 to 100°C and the output signal is 4-20 mA, we will have: